
Excel just got a new friend?!
And I genuinely cannot believe I didn’t discover it sooner.

Honestly, that’s on me because I did not expect to care this much about an AI plugin inside Excel.
And we all know why…
Most AI tools inside office apps usually feel forced.
So when Claude launched its Excel add-in, I expected the same thing.
But then I tested it on a real spreadsheet, and OMG, I decided that it deserves a guide.
Let me tell you why in section 1.
The weirdest part is..
You do NOT need to be amazing at Excel anymore.
You still need business thinking and judgment.
But the “how do I build this complicated formula” part is handled by Claude.
YES YES all of it. Finance, marketing, or reporting, you name it!
But before we start..
This is not another 10 AI hacks or fake motivational AI articles.
I actually tested this properly.
And I want to show you:
What actually works
What feels overrated
The prompts worth stealing
The workflows that save the most time
Where people still waste hours unnecessarily
Also, please do not just read this passively.
Open Excel while reading.
The guide makes WAY more sense when you test things live.
So let’s gooo
I build, test, and share everything in public so others can learn faster. If you want to support that, sharing is the biggest boost.
1. First… What even is Claude inside Excel?
Here’s the simplest explanation I can give:
Imagine ChatGPT (yeah, I still use it sometimes) inside Excel
If you want to know why I am preferring Claude, here’s the reason
Instead of only replying with text, it can work directly inside the spreadsheet.
If you’ve done it, you know the difference now.. But if not, let me tell you with an example:
So you type: “Build a 12-month revenue forecast.”
And Claude creates this:
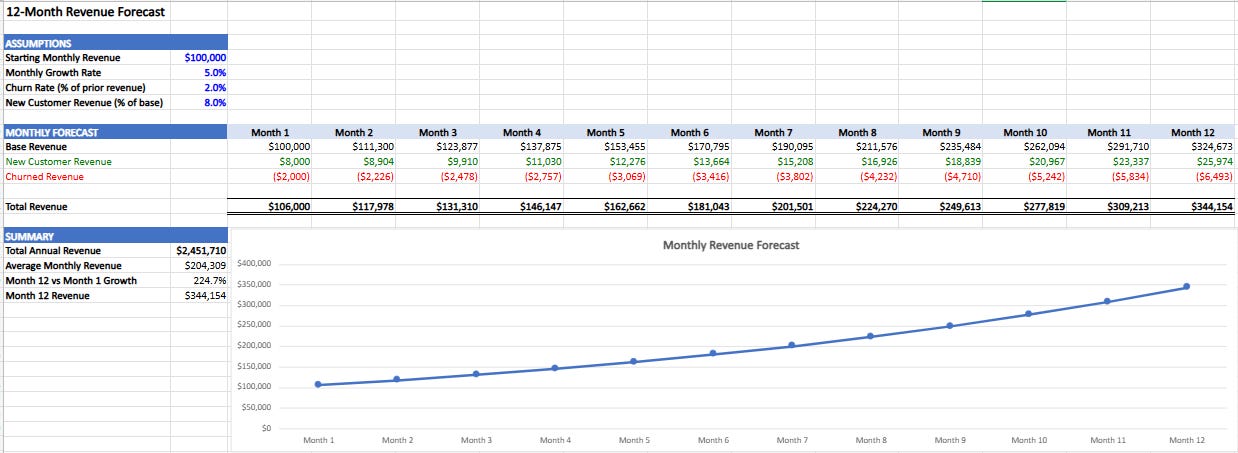
Within 5 minutes
Now coming to the BEST part..
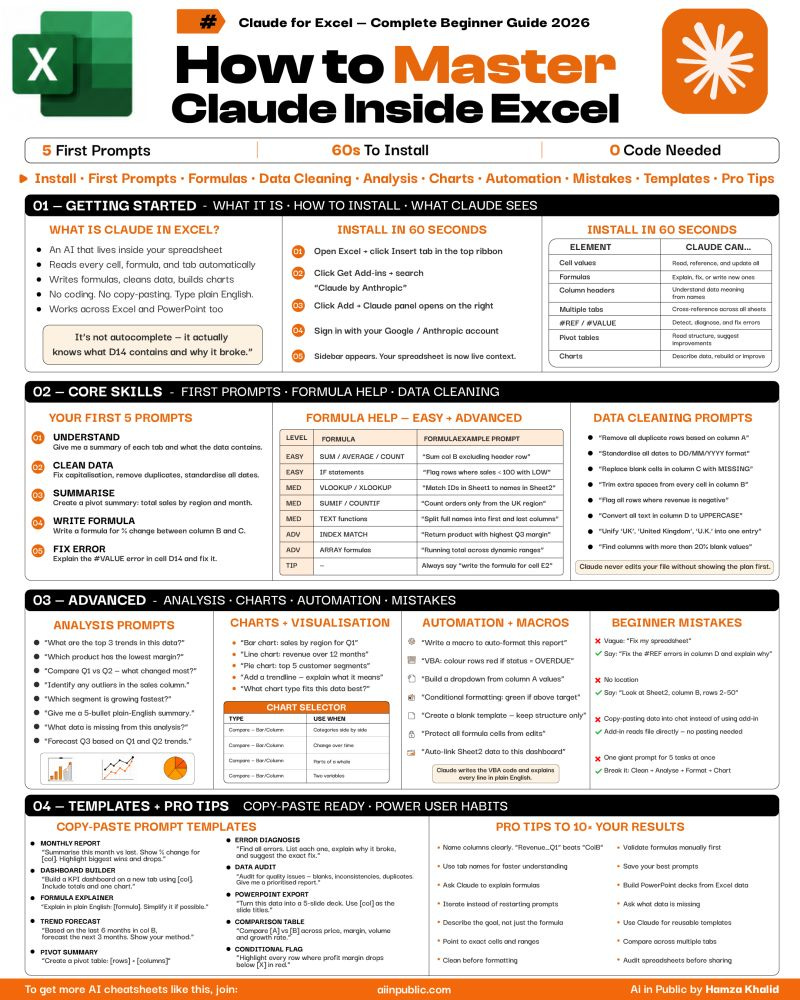
2. Installing it ONLY takes like 2 minutes
Here’s the visual explanation, step-by-step:
Step 1
Open Claude
Step 2
Click download.

Step 3
Open the Excel app or online Excel
Step 4
Go to the Home section and then the add-ins. Click it.

Step 5
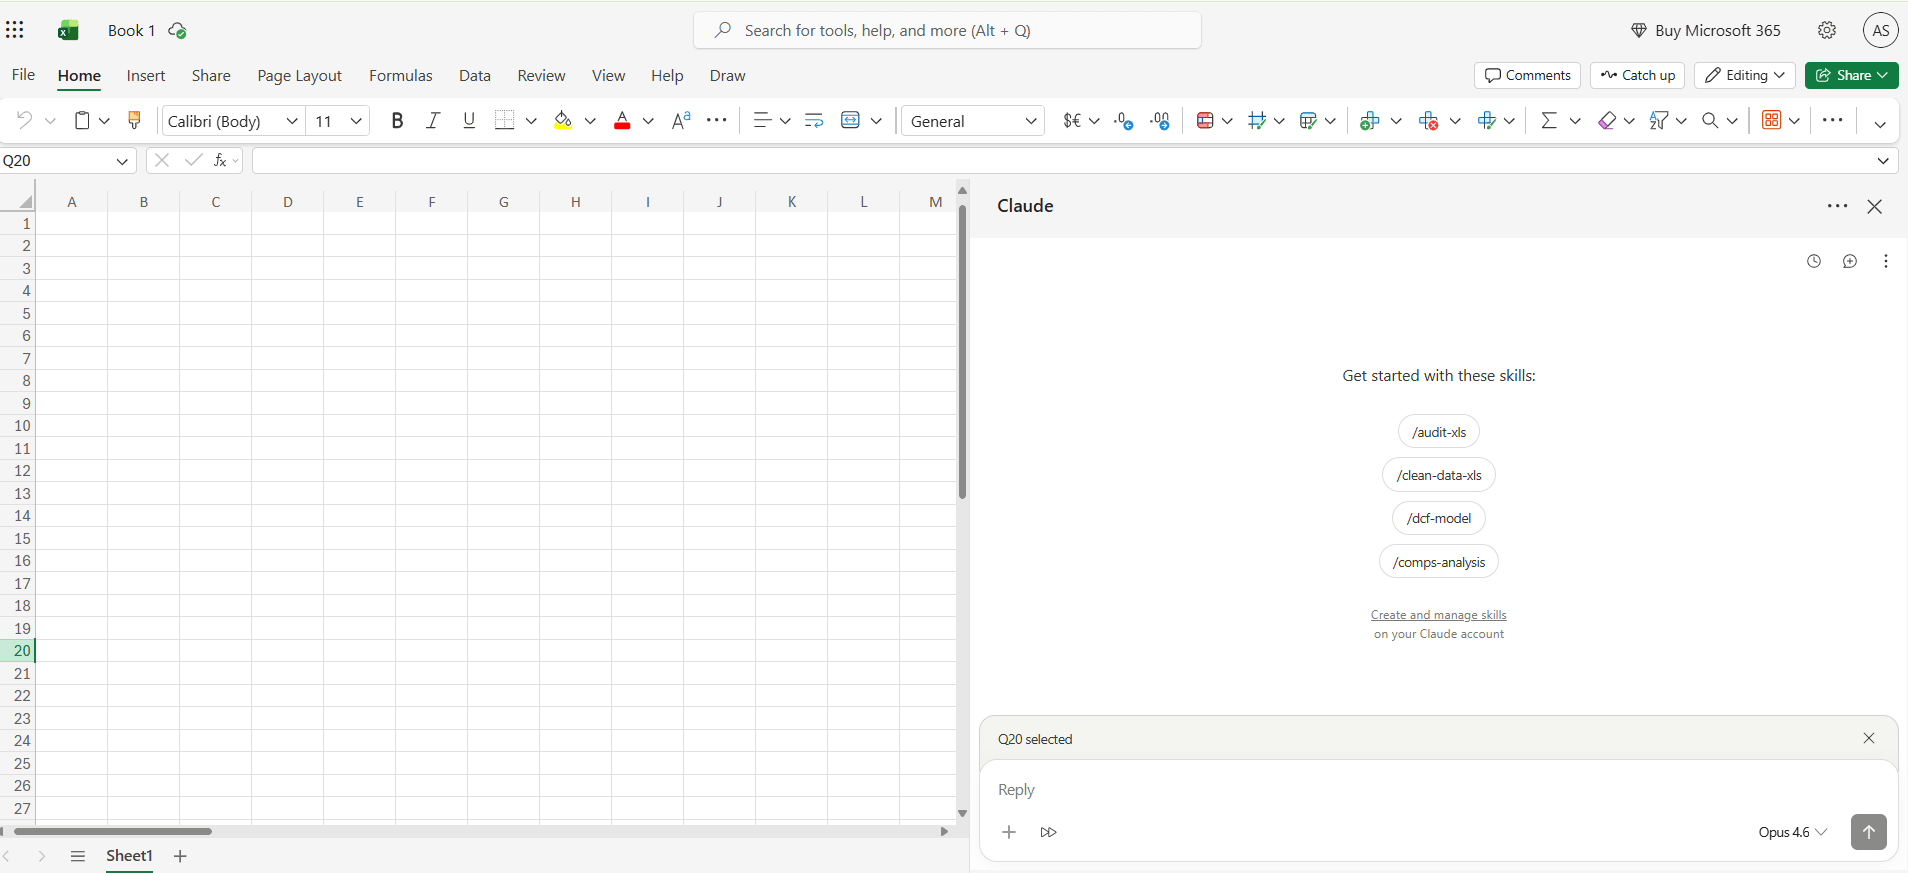
Search for Claude.
Here’s what you’ll find:
Well mine is already added. Can’t survive without it :D

But you just need to click ‘add’ or ‘get’ to get yours.
And ta-da it’s done!!
No coding or complicated workflow. That surprised me too!
But wait until you see the results.
3. My first real test
I did NOT start with “make me a pretty dashboard,” or maybe I did, but I don’t anymore. It’s so much more than that.
(So DON’T waste your time like that)
I tested a real finance use case instead.
I typed: “Build a 24-month revenue model for an ecommerce business with assumptions, growth rates, dynamic formulas and charts.” (you can add more)
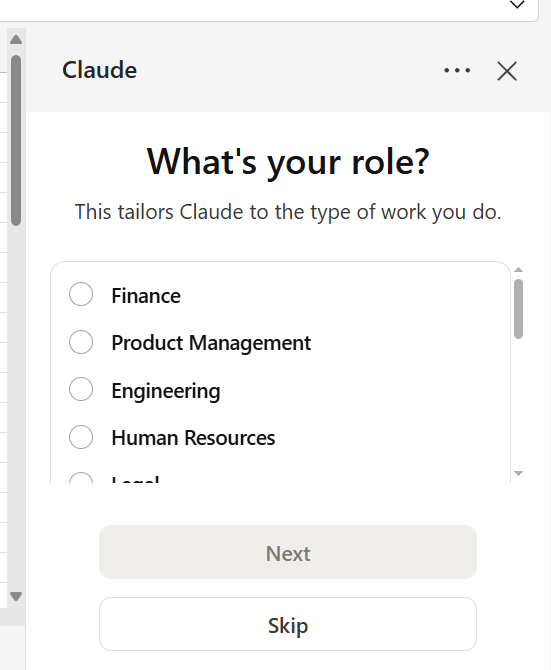
It may ask you some questions like this:
Fill it according to your requirements, or you can just skip it.
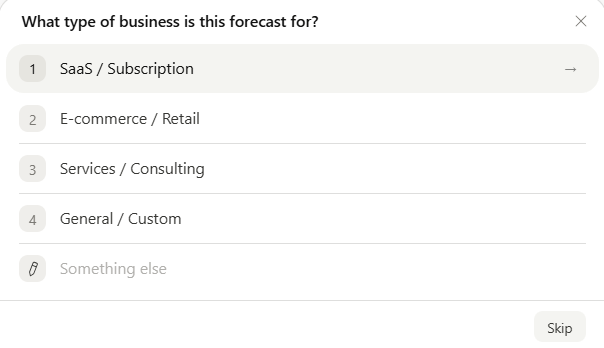
Then it may ask for your preference as well.
And at first glance, this may feel annoying!
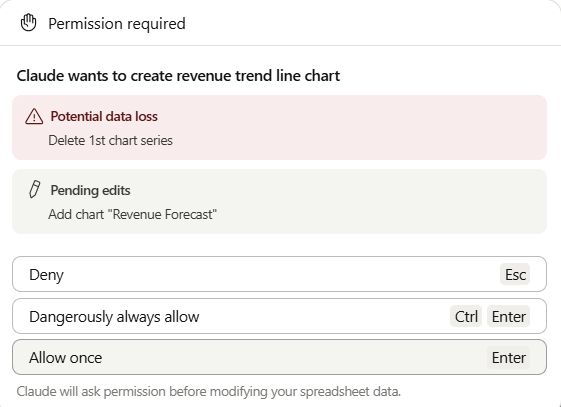
But actually… It’s the reason this works in real companies.
Because imagine it breaks your model. Yeah… no thanks.
So instead, use this right:
Allow once → when testing / unsure/first try
Always allow (dangerously) → when you trust the task + want speed
Deny → when something feels off or overwrites important logic
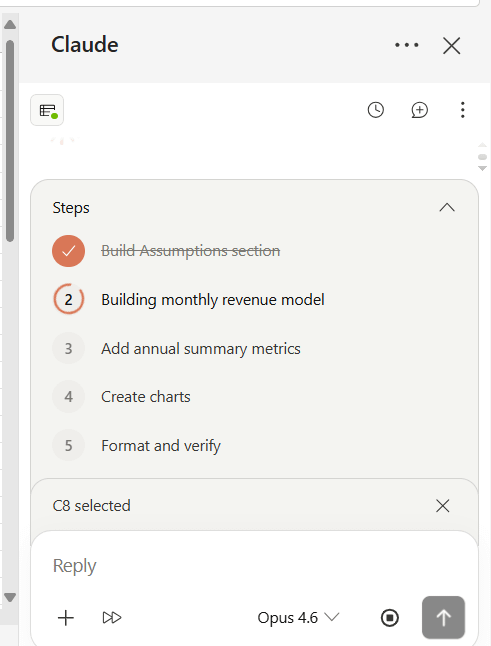
And then I just waited and watched and..
BINGO!
Claude made this workbook for me
That too, without me touching any formulas manually.
I only wrote one prompt.
Meanwhile, that was the process I didn’t have to go through:
4. What makes it actually worth it??
How you use it, of course!
Stay with me to know the HOW too..
I’ve seen most people prompt this thing completely wrong.
They say things like: “Create formulas in row D.” Or: “Add SUMIF formulas.”
Wrong! That approach is too mechanical.
The better approach is explaining the BUSINESS problem instead of micromanaging Excel.
For example: Instead of: “Add formulas for monthly growth.”
Say: “I manage an e-commerce business and need to understand monthly profitability trends.”
e.g.: Here’s the prompt I used that actually works. Copy this.
Act as an expert financial modeler.
I run an e-commerce company selling consumer electronics. Two product lines.
Accessories: $45 average order value, 2,000 orders per month, 6% monthly growth, 35% gross margin.
Devices: $280 average order value, 500 orders per month, 4% monthly growth, 22% gross margin.
Build a 24-month revenue and gross profit model across two tabs.
Assumptions tab with all input variables.
Model tab with monthly calculations, a total revenue sanity check row, and a chart showing revenue by product line.
Use dynamic formulas referencing the assumptions tab throughout.
Follow investment banking formatting conventions: blue cells for inputs, black for formulas.
That gives Claude context.
And context changes the quality of results massively.
Don’t worry, it’ll fix your present files too..
Because most companies already have giant finance files and trackers nobody wants to rebuild
So I tested this next.
I typed: “Add a marketing spend assumption to the assumptions tab as a percentage of total revenue. Use 12% as the baseline. Add a contribution margin row to the model tab calculating gross profit minus marketing spend for each month. Update the chart to show contribution margin as a third line.”
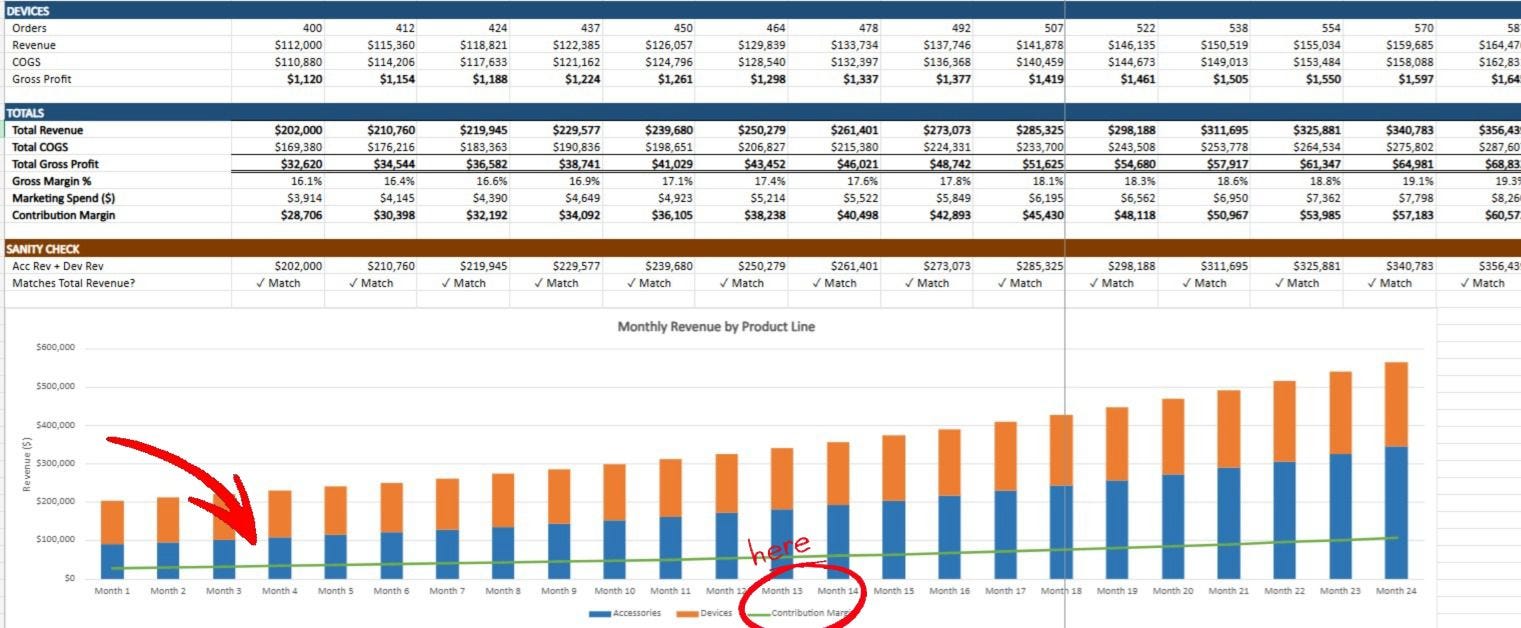
Still no formula typed by me.
★ Bonus: You never need to re-explain your model when you want to add something. Claude reads the file and picks up exactly where it left off.
And that part made me keep testing it more and more..
Before:
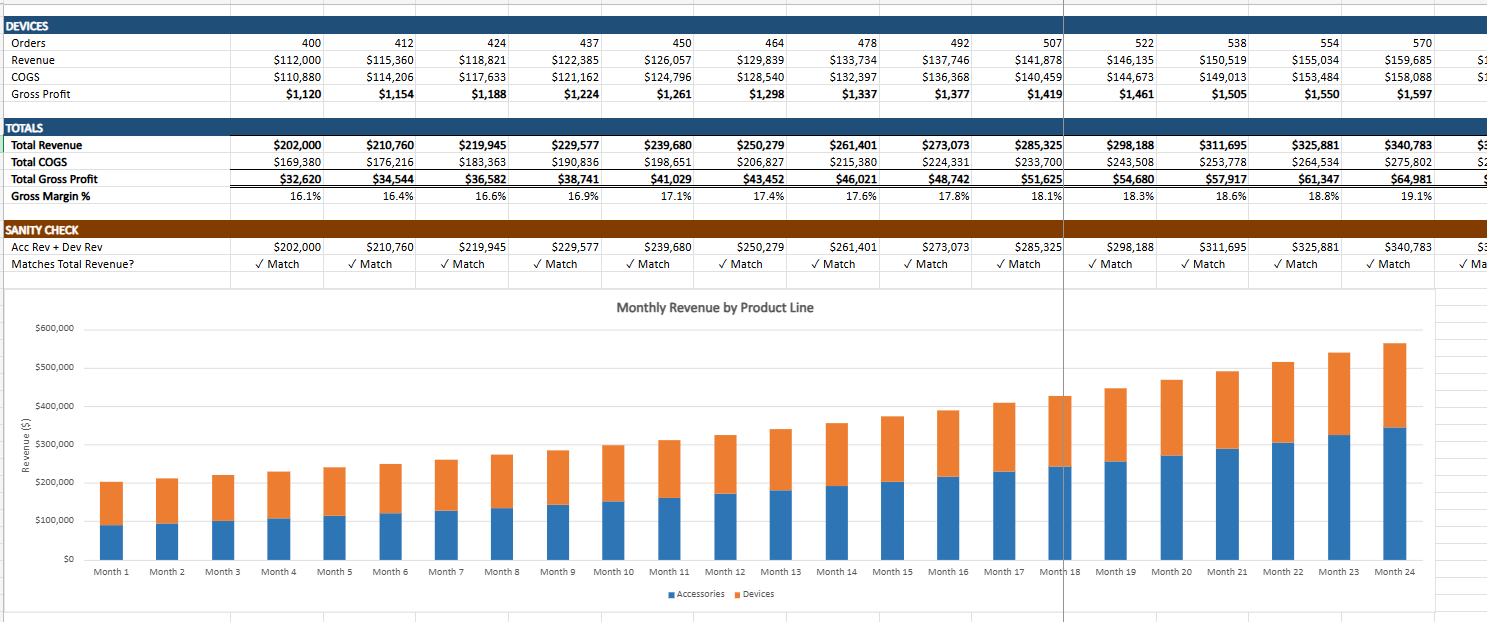
vs. After:
Oh, this one is insanely useful.
Because I know every company has that one spreadsheet that feels cursed.
So you open the file and see something like:
=INDEX(MATCH(XLOOKUP...

And your brain just wants to shut down then, right?
But now you can simply highlight the cells and ask:
“Explain this formula like I’m new to Excel.”
And Claude explains it surprisingly well.
This alone will save people HOURS.
5. The SECRET prompting trick that improved my results immediately
The best prompts usually contain 4 things (well.. shortly cause there’s so much more:)
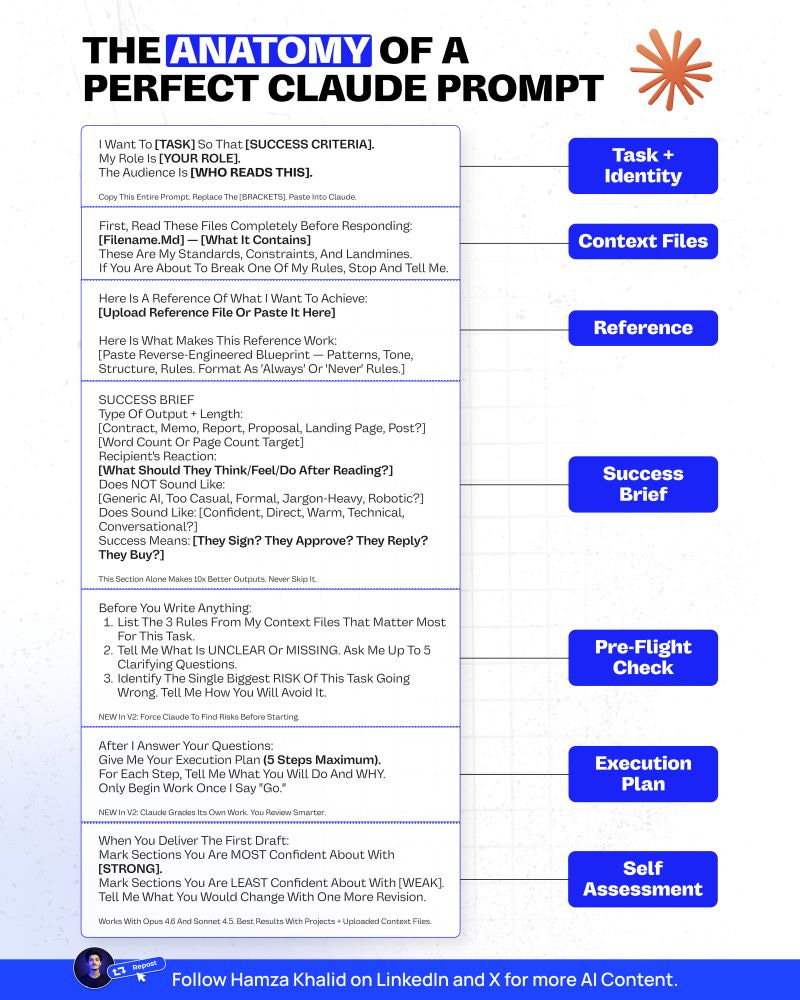
And that’s my formula everywhere, so grab and save it right now! More on LinkedIn
1. ROLE
Tell Claude who it is.
Example: “Act as a finance analyst…”
2. CONTEXT
Explain the business situation.
Example: “We run a SaaS company…”
3. OUTPUT
Say what you actually want.
Example: “Build a 12-month forecasting model…”
4. CONSTRAINTS
Protect important parts.
Example: “Do not modify existing formulas.”
You can build your own personal prompt like this or just copy and paste the next ones..
6. The prompts are actually worth stealing for 4 different situations
These are real ones I tested with results.
The four models every AI founder needs
a. If you want to stop guessing your runway:
I’m the founder of an AI SaaS company.
We have $[X] in the bank. Monthly burn is $[Y].
We have [Z] customers at $[MRR]/month with [churn]% monthly churn.
Build an 18-month runway model with three scenarios: base case at current trajectory, growth case at [X]% new customer monthly growth, stretch case at [X]% growth.
Show the exact month we hit zero in each scenario.
Assumptions tab. Model tab with monthly cash balance for all three scenarios side by side.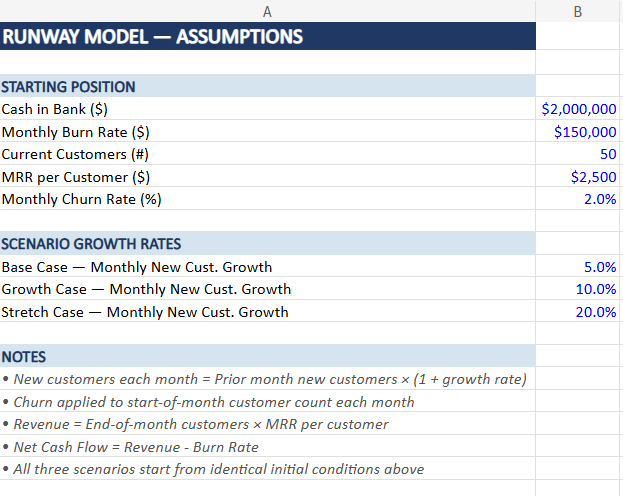
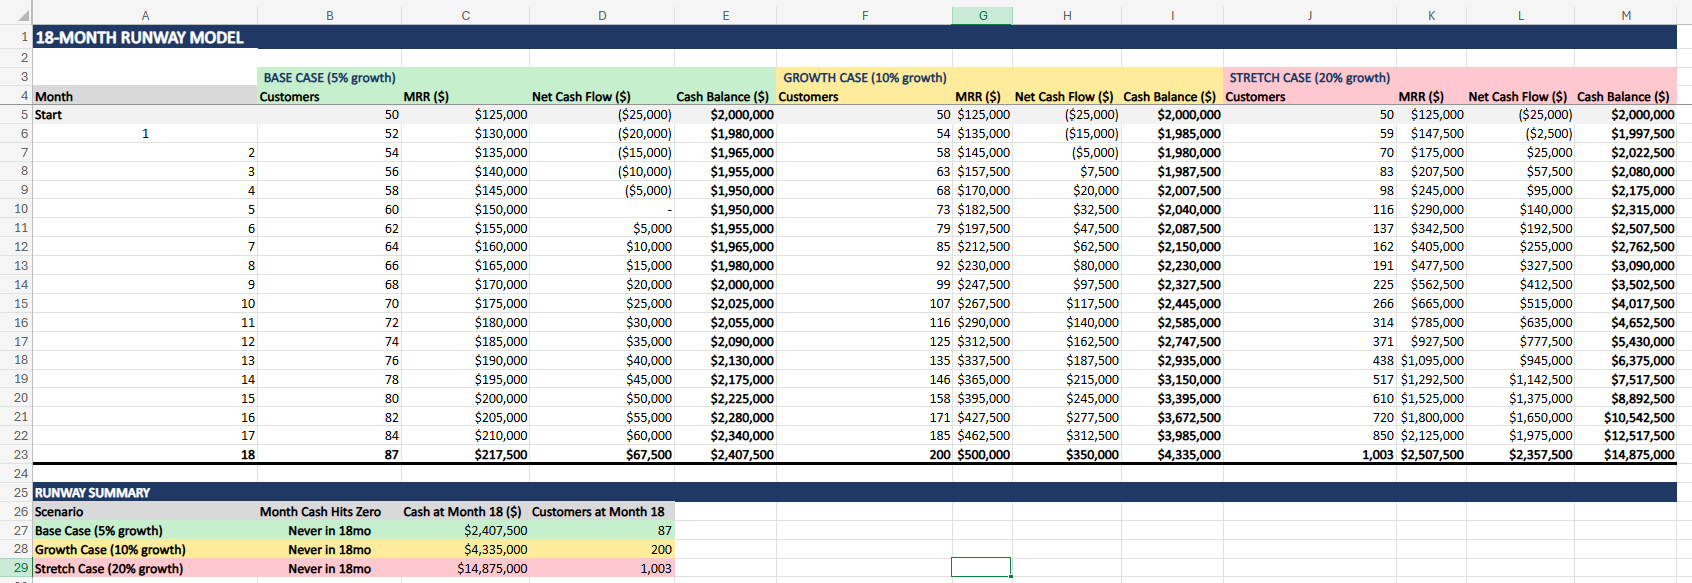
I know most founders say they know their runway but almost none of them have it modeled with real scenario branches.
This prompt will fix that in about 7 minutes.
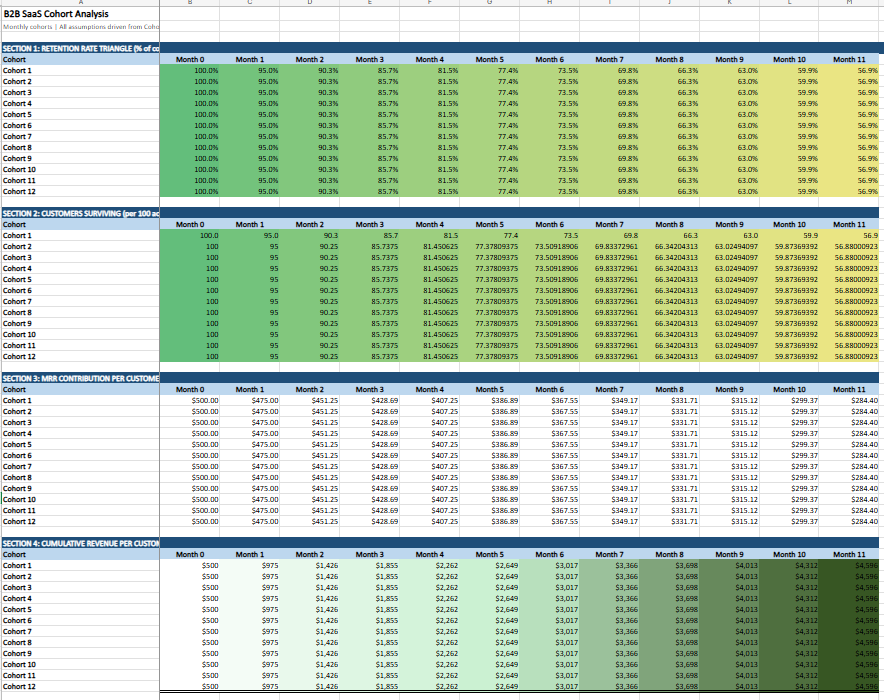
B. If your retention numbers feel fuzzy:
Build a cohort analysis for a B2B SaaS business.
Monthly cohorts join at $[X] MRR per customer with [Y]% monthly churn.
Show LTV by cohort month, cumulative revenue per customer, and payback period at $[CAC] acquisition cost.
12 cohorts, 12 months of retention data.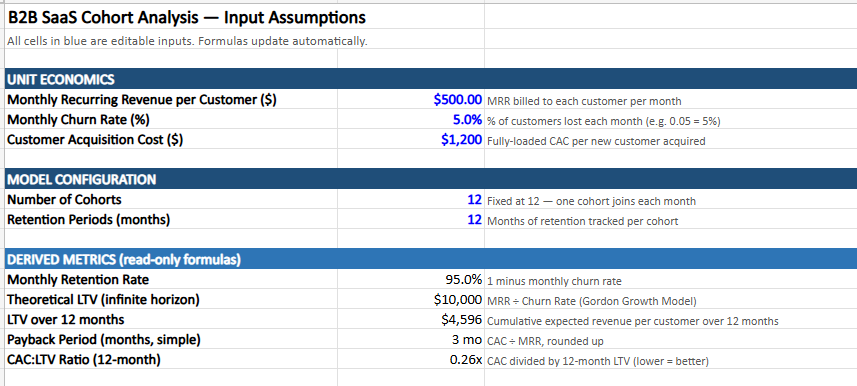
This used to take an analyst a full day. And it almost always had at least one broken reference by the time you got it. One prompt. Under ten minutes.
C. If you are walking into a fundraiser:
Build an ARR bridge from $[X] ARR today over 12 months.
Columns for new business ARR monthly, expansion from upsells, contraction from downgrades, churned ARR, and net new ARR.
Monthly view. Show beginning ARR, all movements, and ending ARR each month.
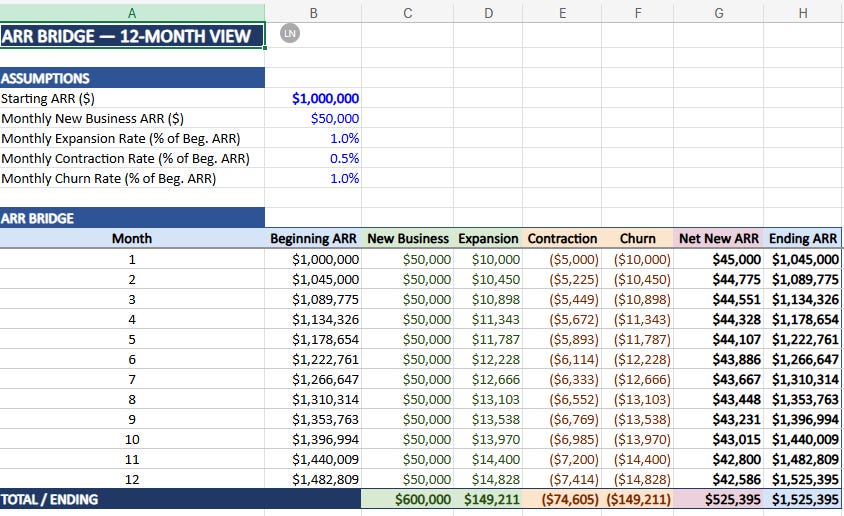
VCs use this exact model to understand your retention story. Walk in having already answered their question before they ask it.
And before Claude burns out just by doing this, read and use this guide of mine before, right here
D. If headcount costs are a gut feeling:
Build a headcount planning model for a [X]-person startup scaling to [Y] people over 18 months.
Current team: [your list by department].
Monthly hires by department, fully-loaded cost per hire in the assumptions tab, total headcount cost monthly, and headcount cost as a percentage of revenue at $[X] MRR growing [Y]% monthly.
And here are the 3 tabs you get:
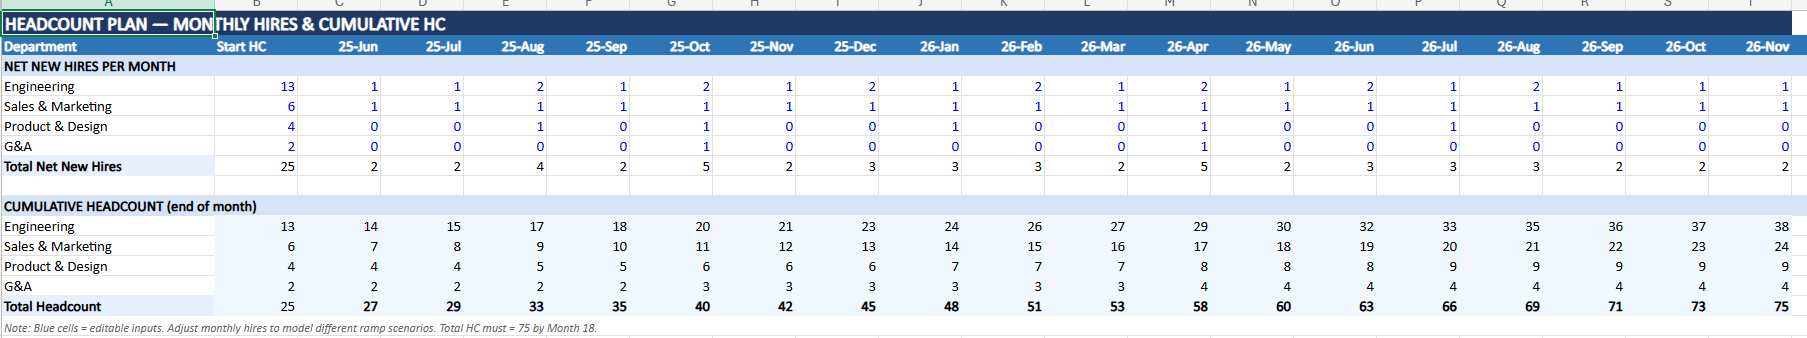
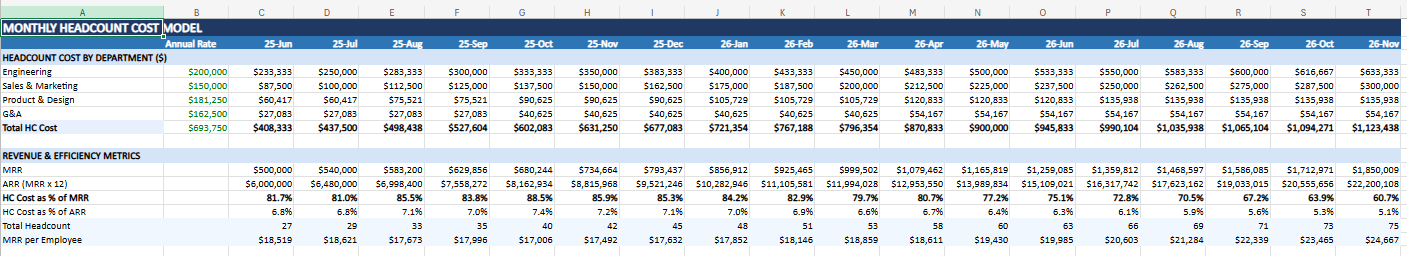
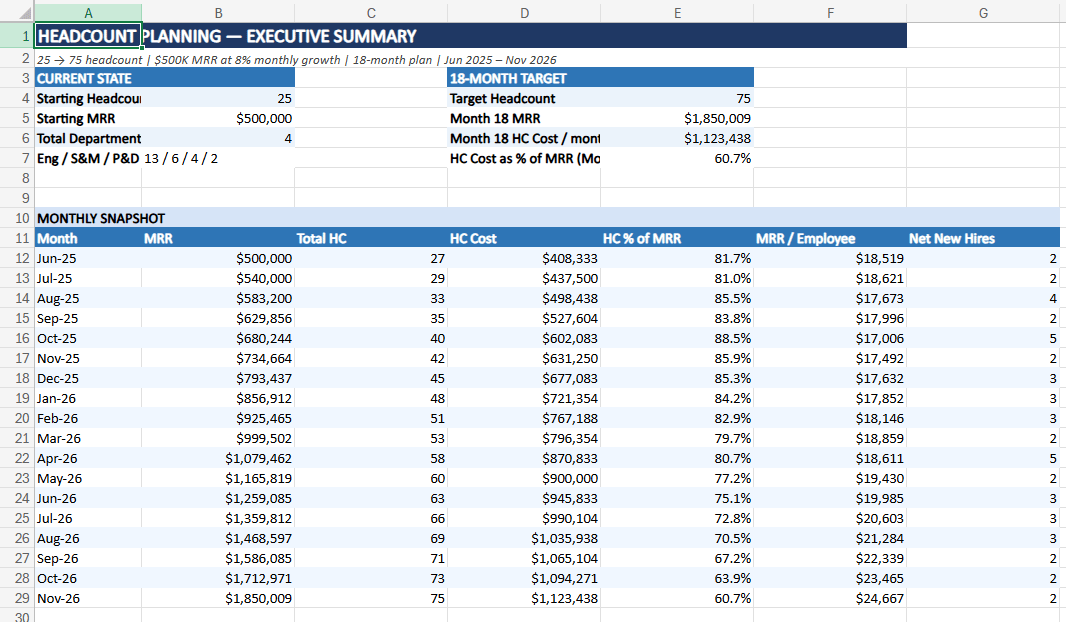
The number in your head and the number the model shows are rarely the same. Run this before your next board update.
✓ Same rule for every prompt above: describe the business situation and not the spreadsheet structure.
Now the MOST important part..
This tool is NOT magic.
Right now:
→ VBA support is weak
→ History resets sometimes
→ You still need human review
→ Large, messy sheets can confuse it
So please do NOT blindly trust outputs.
(It’s awesome, but I say this for every tool)
Because that’s the future. We still need our judgment.
And here you go with the revision/ summary part:
Your homework
My goal is to actually help you get better with AI, and that’s why we have a 110k+ community, so don’t just read about it alone.
Tonight:
Open Excel.
Install Claude.
And try ONE real task.
Something from your actual work.
Even something simple like: “Explain this spreadsheet to me.”
You’ll probably have the same reaction I did: “Wait… it can actually do that?”
One last thing before you go.
I want to make this newsletter more useful for you.
So I’m adding a quick poll:
Your answers will literally decide what I write next.
I don’t want to guess what you need. I’d rather build it with you.
PS. If this helped you, forward it. That is how this list grows. Readers like you are sending it to people like them.
One issue a week. Only the things that actually work.
And for shorter takes between issues, follow me on X → Hamza Khalid
Hamza 💙
Now I can tell my grandchildren how back in my day you had to Google Excel formulas.
Level up