
How to build an app with Claude Artifacts
95% of people use Claude to get just answers. Only 5% of people use it to build things.

But here’s my system for you, what I built and what it replaced.
You’re using Claude at 20%. Maybe less.
Most people still do this:

Type a question → Get text back → Copy it somewhere else → Do the work yourself.
That workflow made sense two years ago. It doesn’t anymore.
But that’s not what Claude does now.
By the end of this issue, you’re getting a FREE Artifacts Prompt Starter Kit - 7 copy paste ready to use prompts.
If this is useful, share it with one person still copy-pasting everything in and out of Claude. That’s the best thing you can do for this newsletter.
A few weeks ago, someone replied to my newsletter and asked:
“Does Claude actually save time, or is it just hype?”
It basically runs my whole system now, but just for quick proof.
I opened Claude and typed one line.
A few seconds later, a working calculator appeared on my screen.
I sent it over and said, “Try your numbers.”
That is Claude Artifacts.
What Artifacts actually are.
Most people hear “Artifacts” and think: coding features. Too technical or not for me.
Wrong!
You describe what you want in plain English. Claude renders the working result inside your chat window.
Six types of things Claude can build for you right now:
1. Markdown documents: structured reports, SOPs
2. SVG graphics: flowcharts, diagrams, visual layouts
3. Data visualisations: bar charts, pie charts, line graphs
4. Mermaid diagrams: org charts, process flows, decision trees
5. HTML pages: reports, email templates, landing page mockups
6. React components: interactive calculators, forms, live dashboards
I know many tools do that, but Claude alone does it for you, so you don’t have to switch tabs.
When Claude builds an Artifact, a second panel opens on the right of your screen.
The tool is live. You click it and interact with it. It works.
If this is useful, share it with one person still copy-pasting everything in and out of Claude. That’s the best thing you can do for this newsletter.
Step-By-Step Guide to turn it on
Most people miss this because it’s not obvious where to look.
Step 1. Go to Claude.ai
Open claude.ai
Click on Artifacts on left side menu
Then click New artifact in the top right
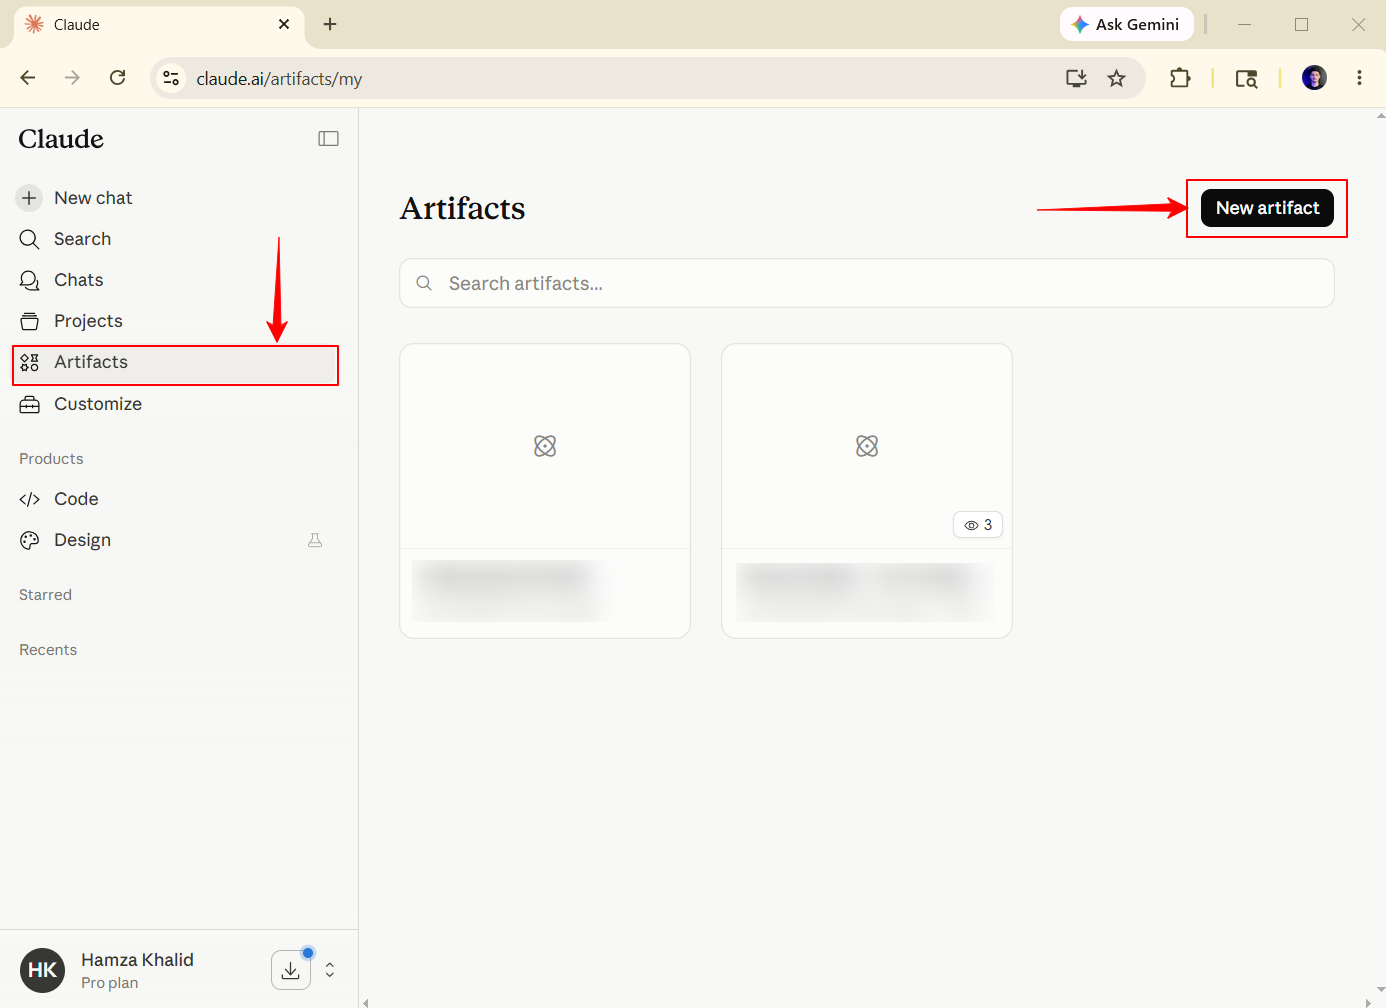
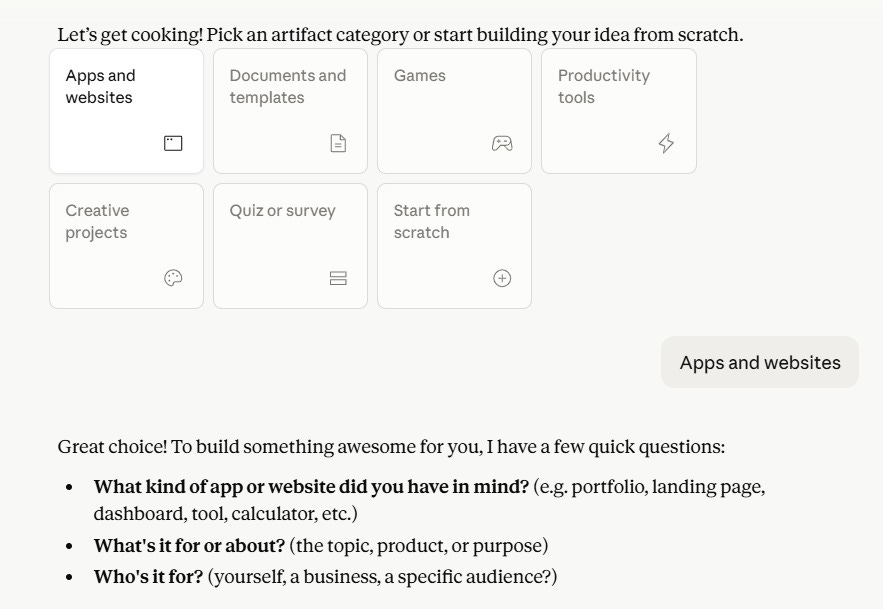
Select a Category or Start from scratch
That’s it. You’re in!
And this is what you get after:
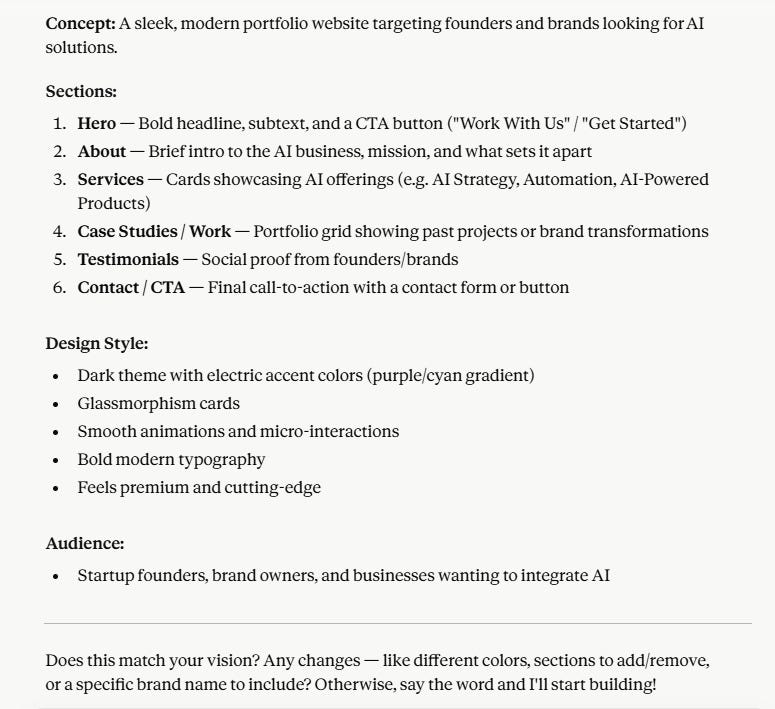
And this is what I got using those built-in artifacts: a portfolio without any specific prompt (you can customize it too)
Or you can now describe what you want in plain English. Claude builds it on the right. You interact with it on the left.
Before moving forward, if you’re new to Claude, you can just read and act on this guide of mine:
Calculator making process (build your own)
Here’s the prompt I used, and it’s not a generic demo.
It easily measures and tracks your investments.
Build an ROI calculator. Inputs: Monthly investment ($), monthly revenue increase ($),
time period (dropdown: 3 / 6 / 12 months). Outputs: Total ROI %, net gain in $,
payback period in months. Clean. Interactive. No placeholder text.
And here’s what I got:
You can choose your options accordingly.
If you did this manually, you would need a spreadsheet, formulas, and constant updates every time a number changes.
That is the difference, my friends!
This newsletter grows from your shares. If you got value from this, pass it on to one person who needs it.
You’re going to say you don’t know how to code.
I know.
That’s not the point.
Just describe it, and Claude will build it.
The skill is being specific about what you want
Don’t type: “make me a calculator.”
Claude makes something generic and useless.
Specificity is the skill, and here’s a guide if you want to have some prompts to refer to it
Click here to access your free guide.
Three more things you can build right now.
A content brief generator you’ll actually use.
Here’s the prompt:
Build me an interactive content brief generator.
Fields:
- Topic (text input)
- Audience (dropdown: Beginners / Intermediate / Advanced)
- Content type (dropdown: Blog / LinkedIn / Newsletter / Video)
- Tone (dropdown: Professional / Casual / Punchy / Educational)
- Word count (number, default 800)
Output on clicking “Create Brief”:
1. Goal: one sentence
2. Audience summary: two sentences
3. Key points: 3 bullets
4. Two headline options
5. Suggested CTA
Form on the left, output on the right. Copy-paste ready.
Here’s what I got:
I use this before every newsletter issue I write.
15 seconds. Everything I need to start.
A bar chart from your actual data.
Here’s the prompt:
Here is my data:
January: $42,000
February: $38,500
March: $61,200
Build me a bar chart.
Label each bar with the exact value.
Add a trend line.
Clean minimal style. No gridlines.
Title: “Q1 Revenue”
40 seconds. Professional chart and no spreadsheet.
Here’s what I got:
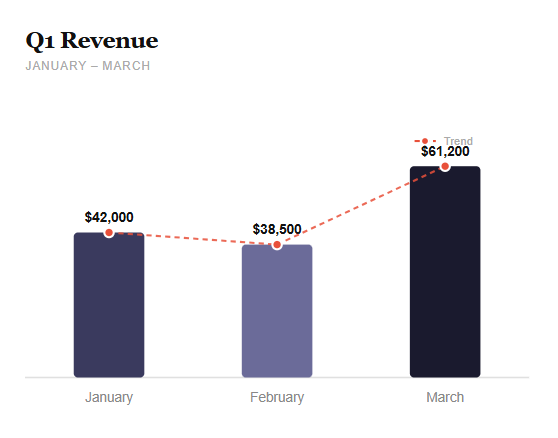
It won’t export as Excel. But for proposals, Notion pages, client emails, a screenshot of this looks better than most Sheets charts.
Plus, you just had to type or copy to build it.
A flowchart of any process.
Here’s the prompt:
Build me a flowchart for a newsletter publishing process.
Steps: Write draft → Self-edit → Send to editor → Revisions →
Final proof → Schedule → Publish → Promote.
Add a branch at “Revisions”: Major changes needed →
Rewrite section → Back to Self-edit.
Render as a clean visual diagram. No code. Just the diagram.
Here’s what I got:
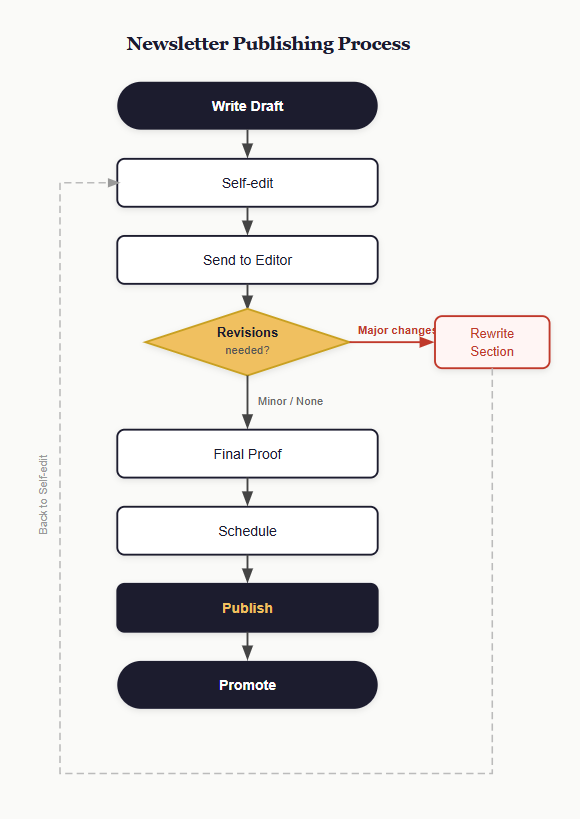
Add “No code. Just the diagram” to every diagram prompt. Without it, Claude sometimes returns raw syntax instead of the visual.
This newsletter grows one share at a time. If someone you know is still spending an hour on things Claude builds in 60 seconds, send this to them.
The one thing that will catch you out.
Before you start building anything in Claude Artifacts, ask for a “mini version first.”
Like this: “Build a simple version with just the core logic first. No styling. No extra features.”
I know most people do the opposite and end up with overcomplicated tools, messy layouts, and features they don’t even use.
But a simple first version gives you a faster working result.
Then you can say: “Now improve the design and add one more feature only.”
That “one layer at a time” approach makes Artifacts feel smooth.
You are not just a text-to-text user anymore.
That was Claude in 2023.
Type a question. Get words back.
Artifacts are something different. Claude builds things you can touch, click, and use inside a conversation you’re already having.
Pause here for a second!
Most people read an issue like this and think: “Cool, I’ll try that later.” Later never comes.
You already have Claude open in another tab. Or you will in the next hour.
Try one prompt from this issue and see what appears. That moment will change how you think about the tool.
Don’t file this for later. Use it today.
Save this. Screenshot it. Come back to it, too.
Your Free Gift as promised:
Here are all the Artifacts Prompt Starter Kit. Free. As promised.
AI TIME SAVINGS CALCULATOR
Build me an interactive AI Time Savings Calculator.

Inputs (sliders): Hours/week on writing (0–20), research (0–15),

email (0–10), social (0–10), hourly rate ($10–$500), AI reduction % (10–90%).

Outputs: hours saved/week, /month, $ saved/month, $ saved/year,

+ one plain-English verdict sentence.

Sliders left, results right. No placeholder text.
BAR CHART FROM DATA
Here is my data: [paste your numbers].

Build a bar chart.

Label each bar.

Add a trend line.

Clean minimal style. No gridlines.

Title: [your title].
PROCESS FLOWCHART
Build a flowchart for [process name].

Steps: [list them in order].

Add a branch at [step] for [exception].

Render as a clean visual diagram. No code. Just the diagram.
CONTENT BRIEF GENERATOR
Build an interactive content brief generator.

Fields: Topic, Audience (dropdown), Content type (dropdown),

Tone (dropdown), Word count.

Output on button click: Goal, audience summary, 3 key points,

2 headlines, CTA. Form left, output right. Copy-paste ready.
LANDING PAGE MOCKUP
Build a simple HTML landing page for [product].

One headline. Three feature bullets.

One CTA button.

Clean and minimal. No placeholder text.
DATA TABLE FORMATTER
Here is my data: [paste].

Format as a clean HTML table, sorted by [column], highest to lowest.

Top 3 rows highlighted in light green. Minimal styling.
ROI CALCULATOR
Build an ROI calculator.

Inputs: Monthly investment ($), monthly revenue increase ($),

time period (dropdown: 3 / 6 / 12 months).

Outputs: Total ROI %, net gain in $, payback period in months.

Clean. Interactive. No placeholder text.
Here are a few issues that you might have missed (go check them out):
Become a paid subscriber: Get every past issue of AI In Public, plus exclusive resources, prompts, and early access to everything I build next.
And for shorter takes between issues, follow me on X → Hamza Khalid
We tested it in public. Now go use it in private.
Hamza 💙
AI in public is a reader-supported publication. To receive new posts and support my work, consider becoming a free or paid subscriber.
I’ve tried it too and it always amazes me. Thanks for the prompt!
Claude Artifacts is one of the fastest ways to turn an idea into something real.