

You have seen my infographics.
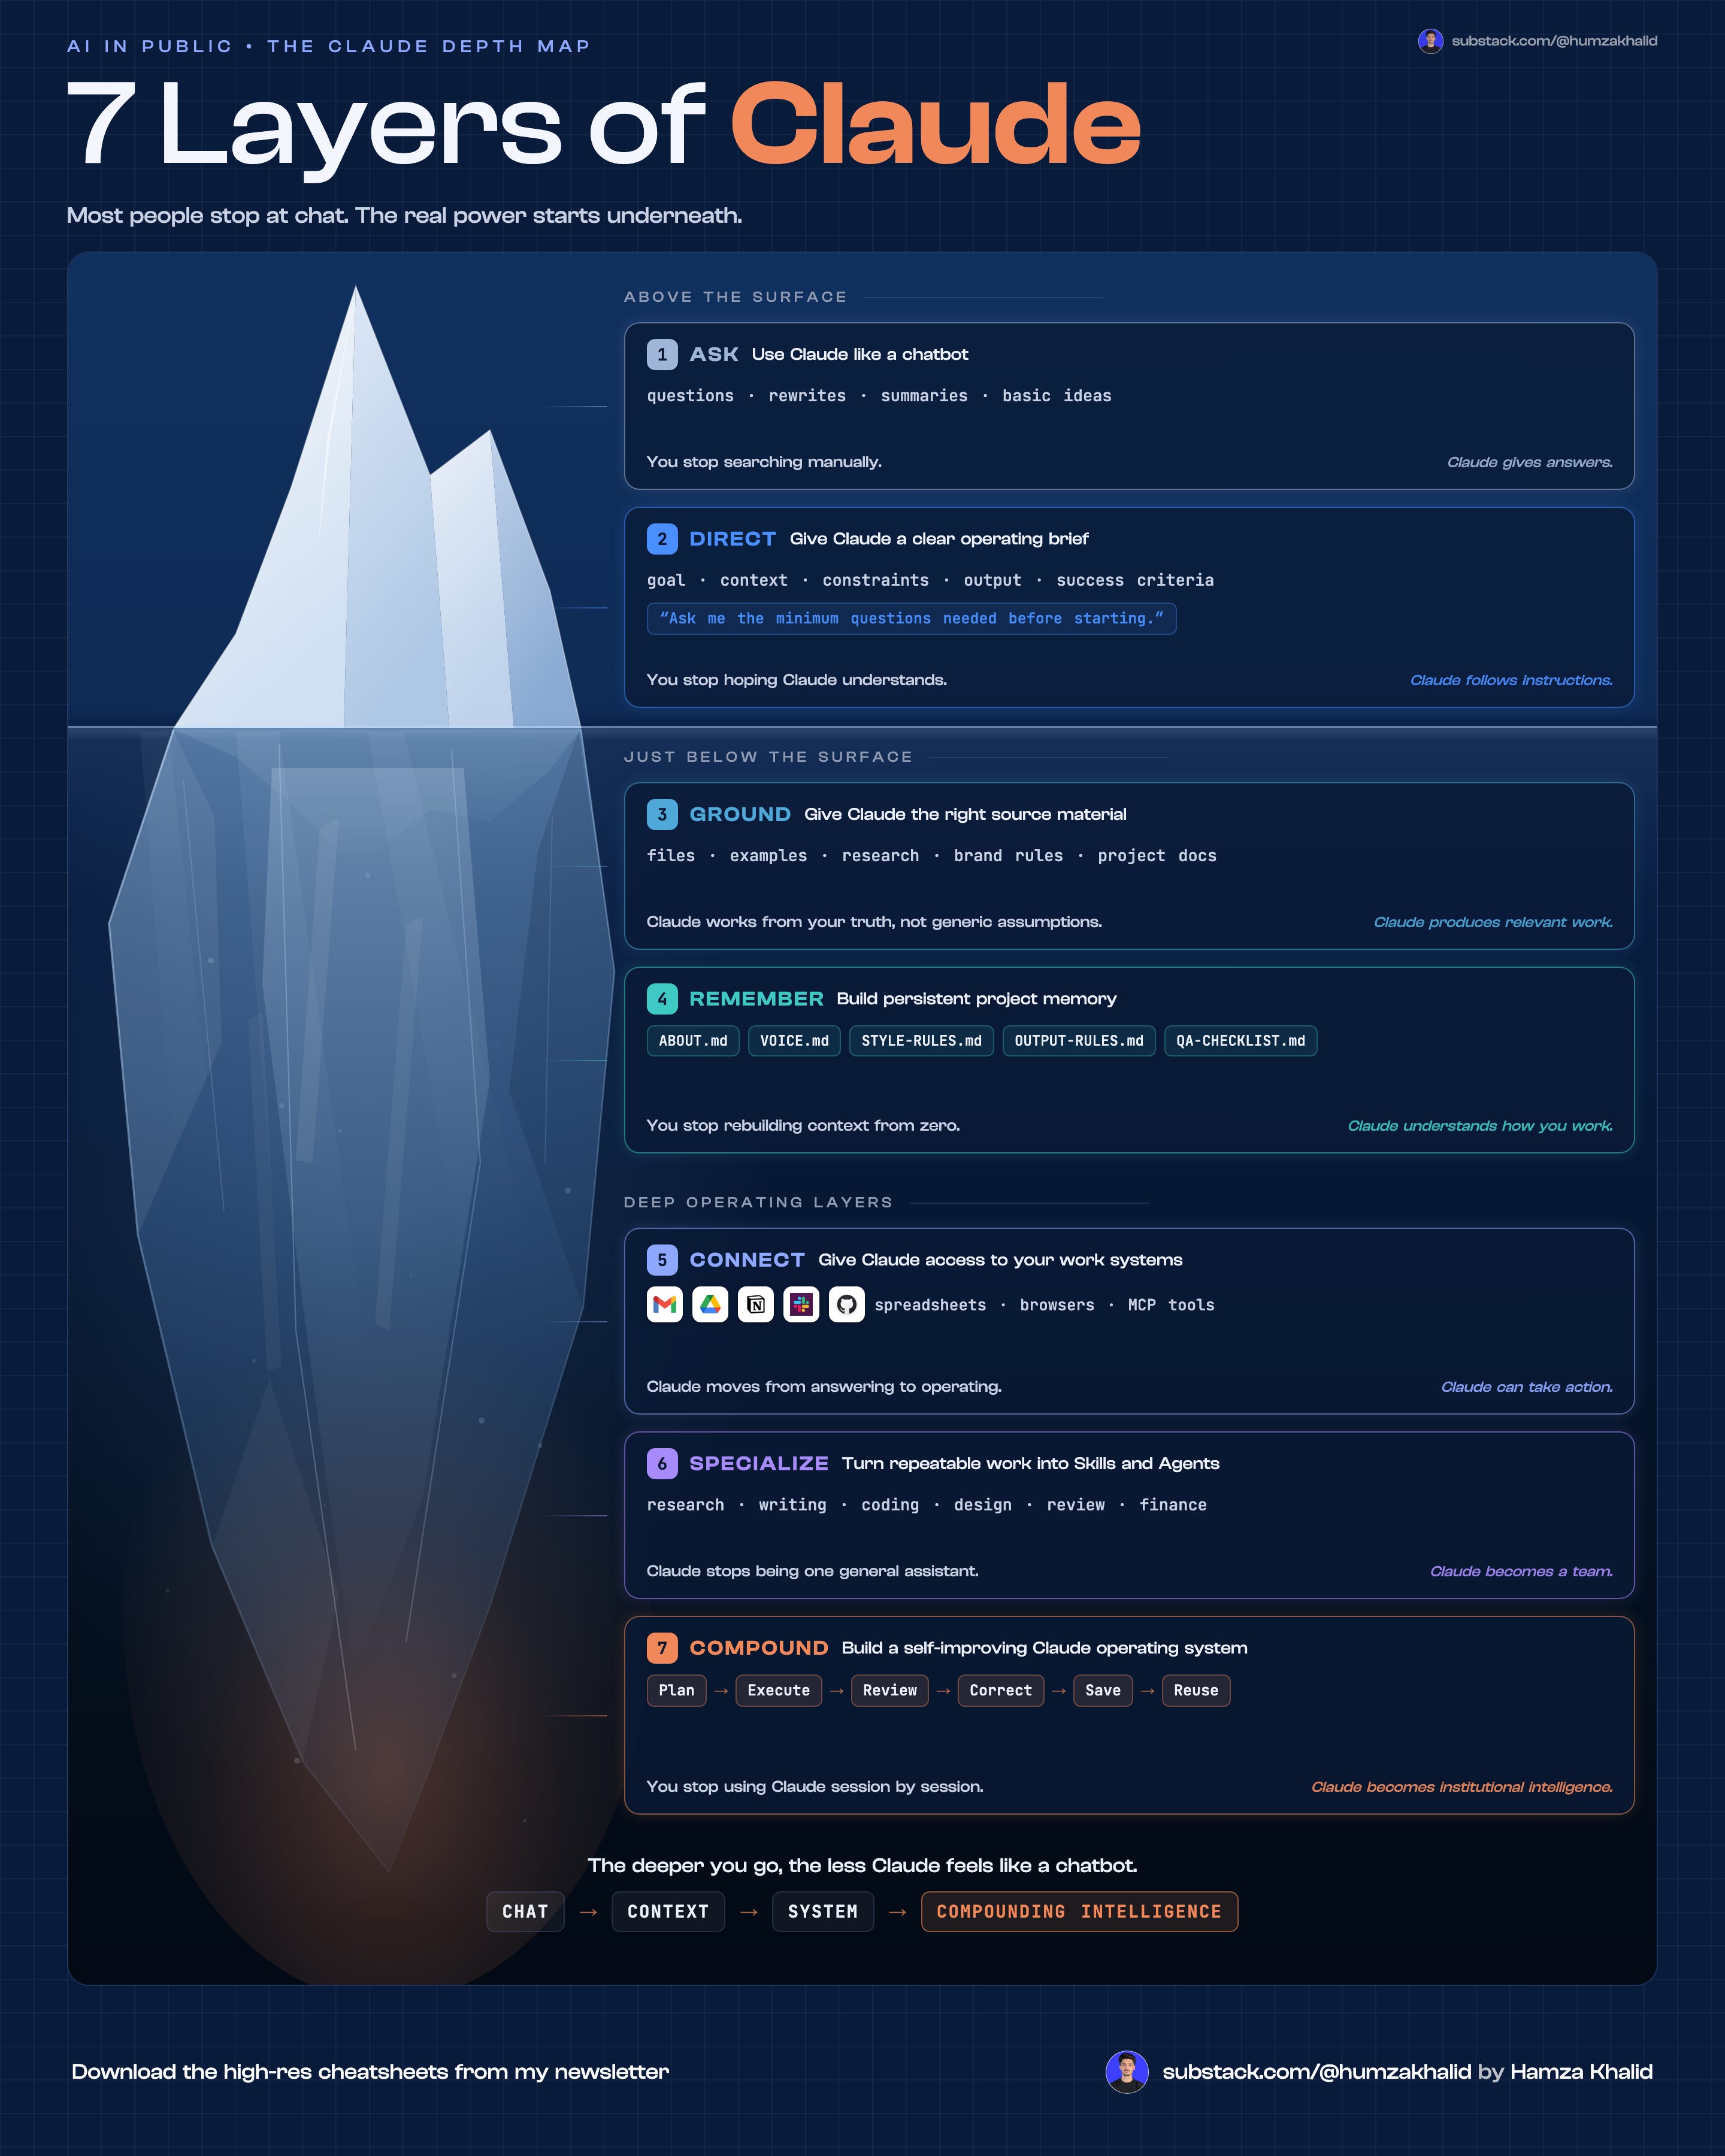
The animated ones. Dotted grid. Blue glow. The ones that stop your thumb.
Yes, I mean this:
Also yes, like this one:
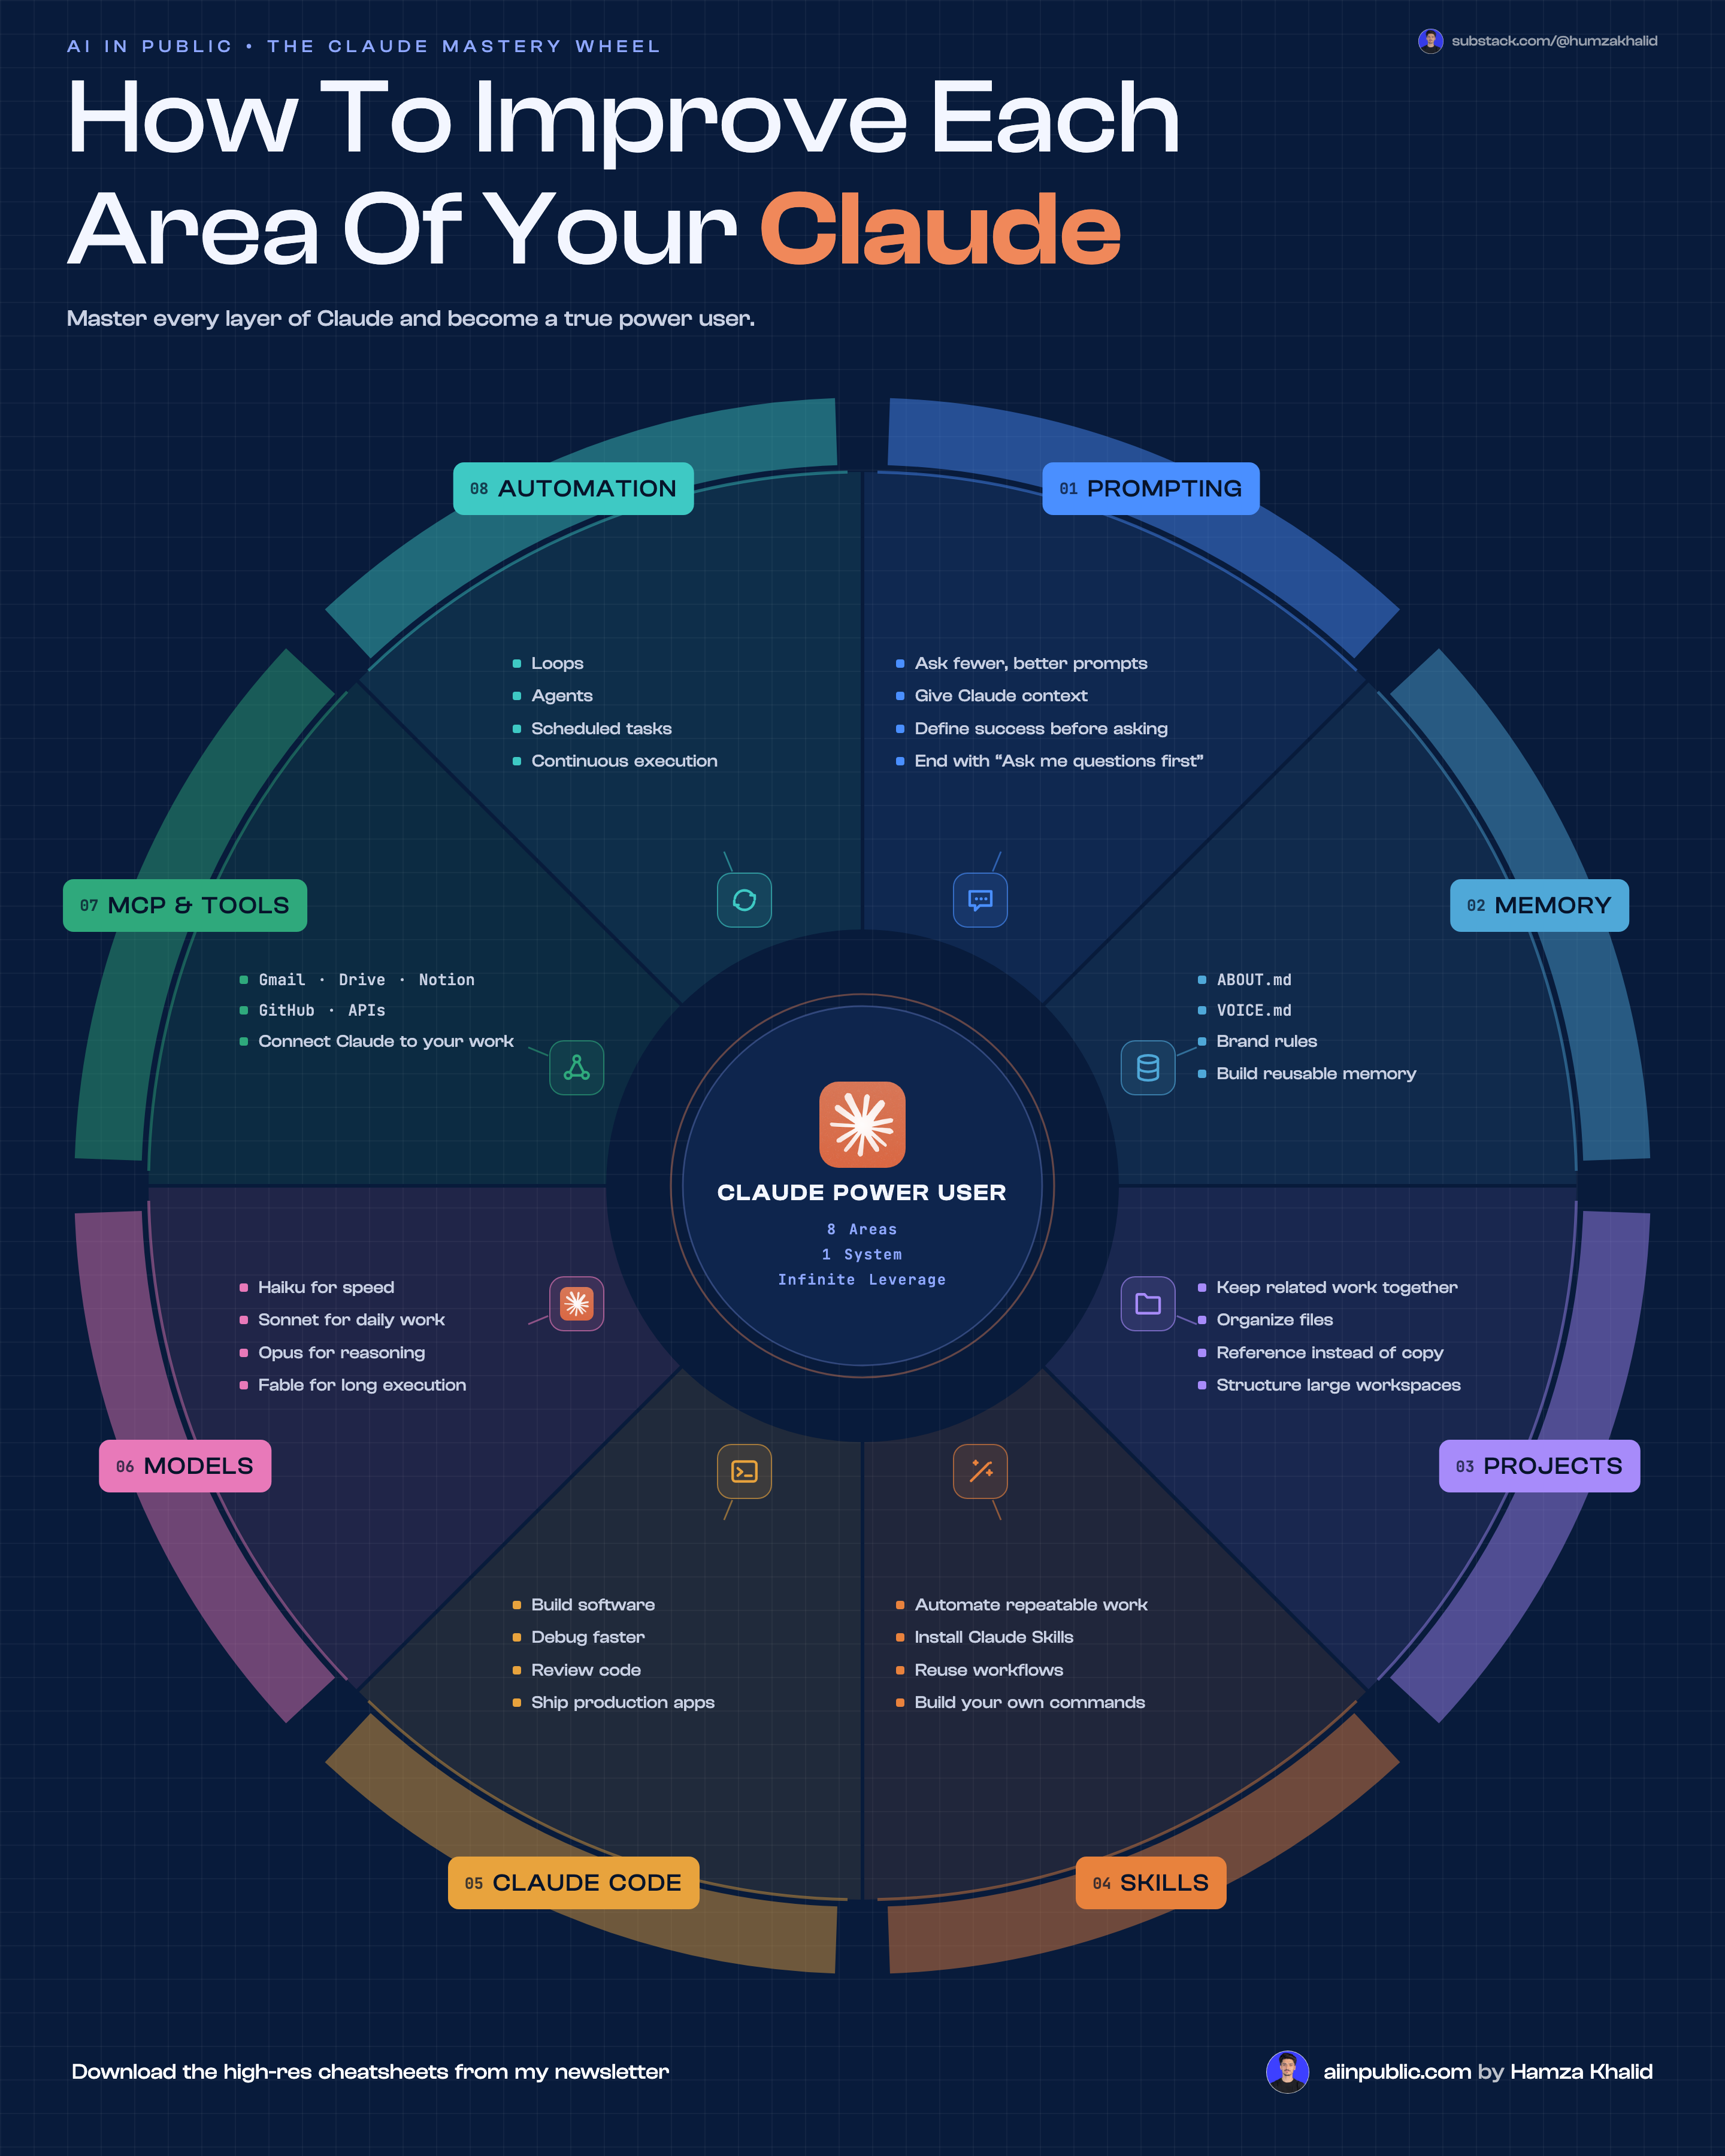
(GIF format is not supported for email readers; I skipped it)…….
Anyways….. we are going to discuss every word on this special topic
You probably assumed a designer made them.
For a long time, you were right.
Not anymore.
I mean, this was the previous work:
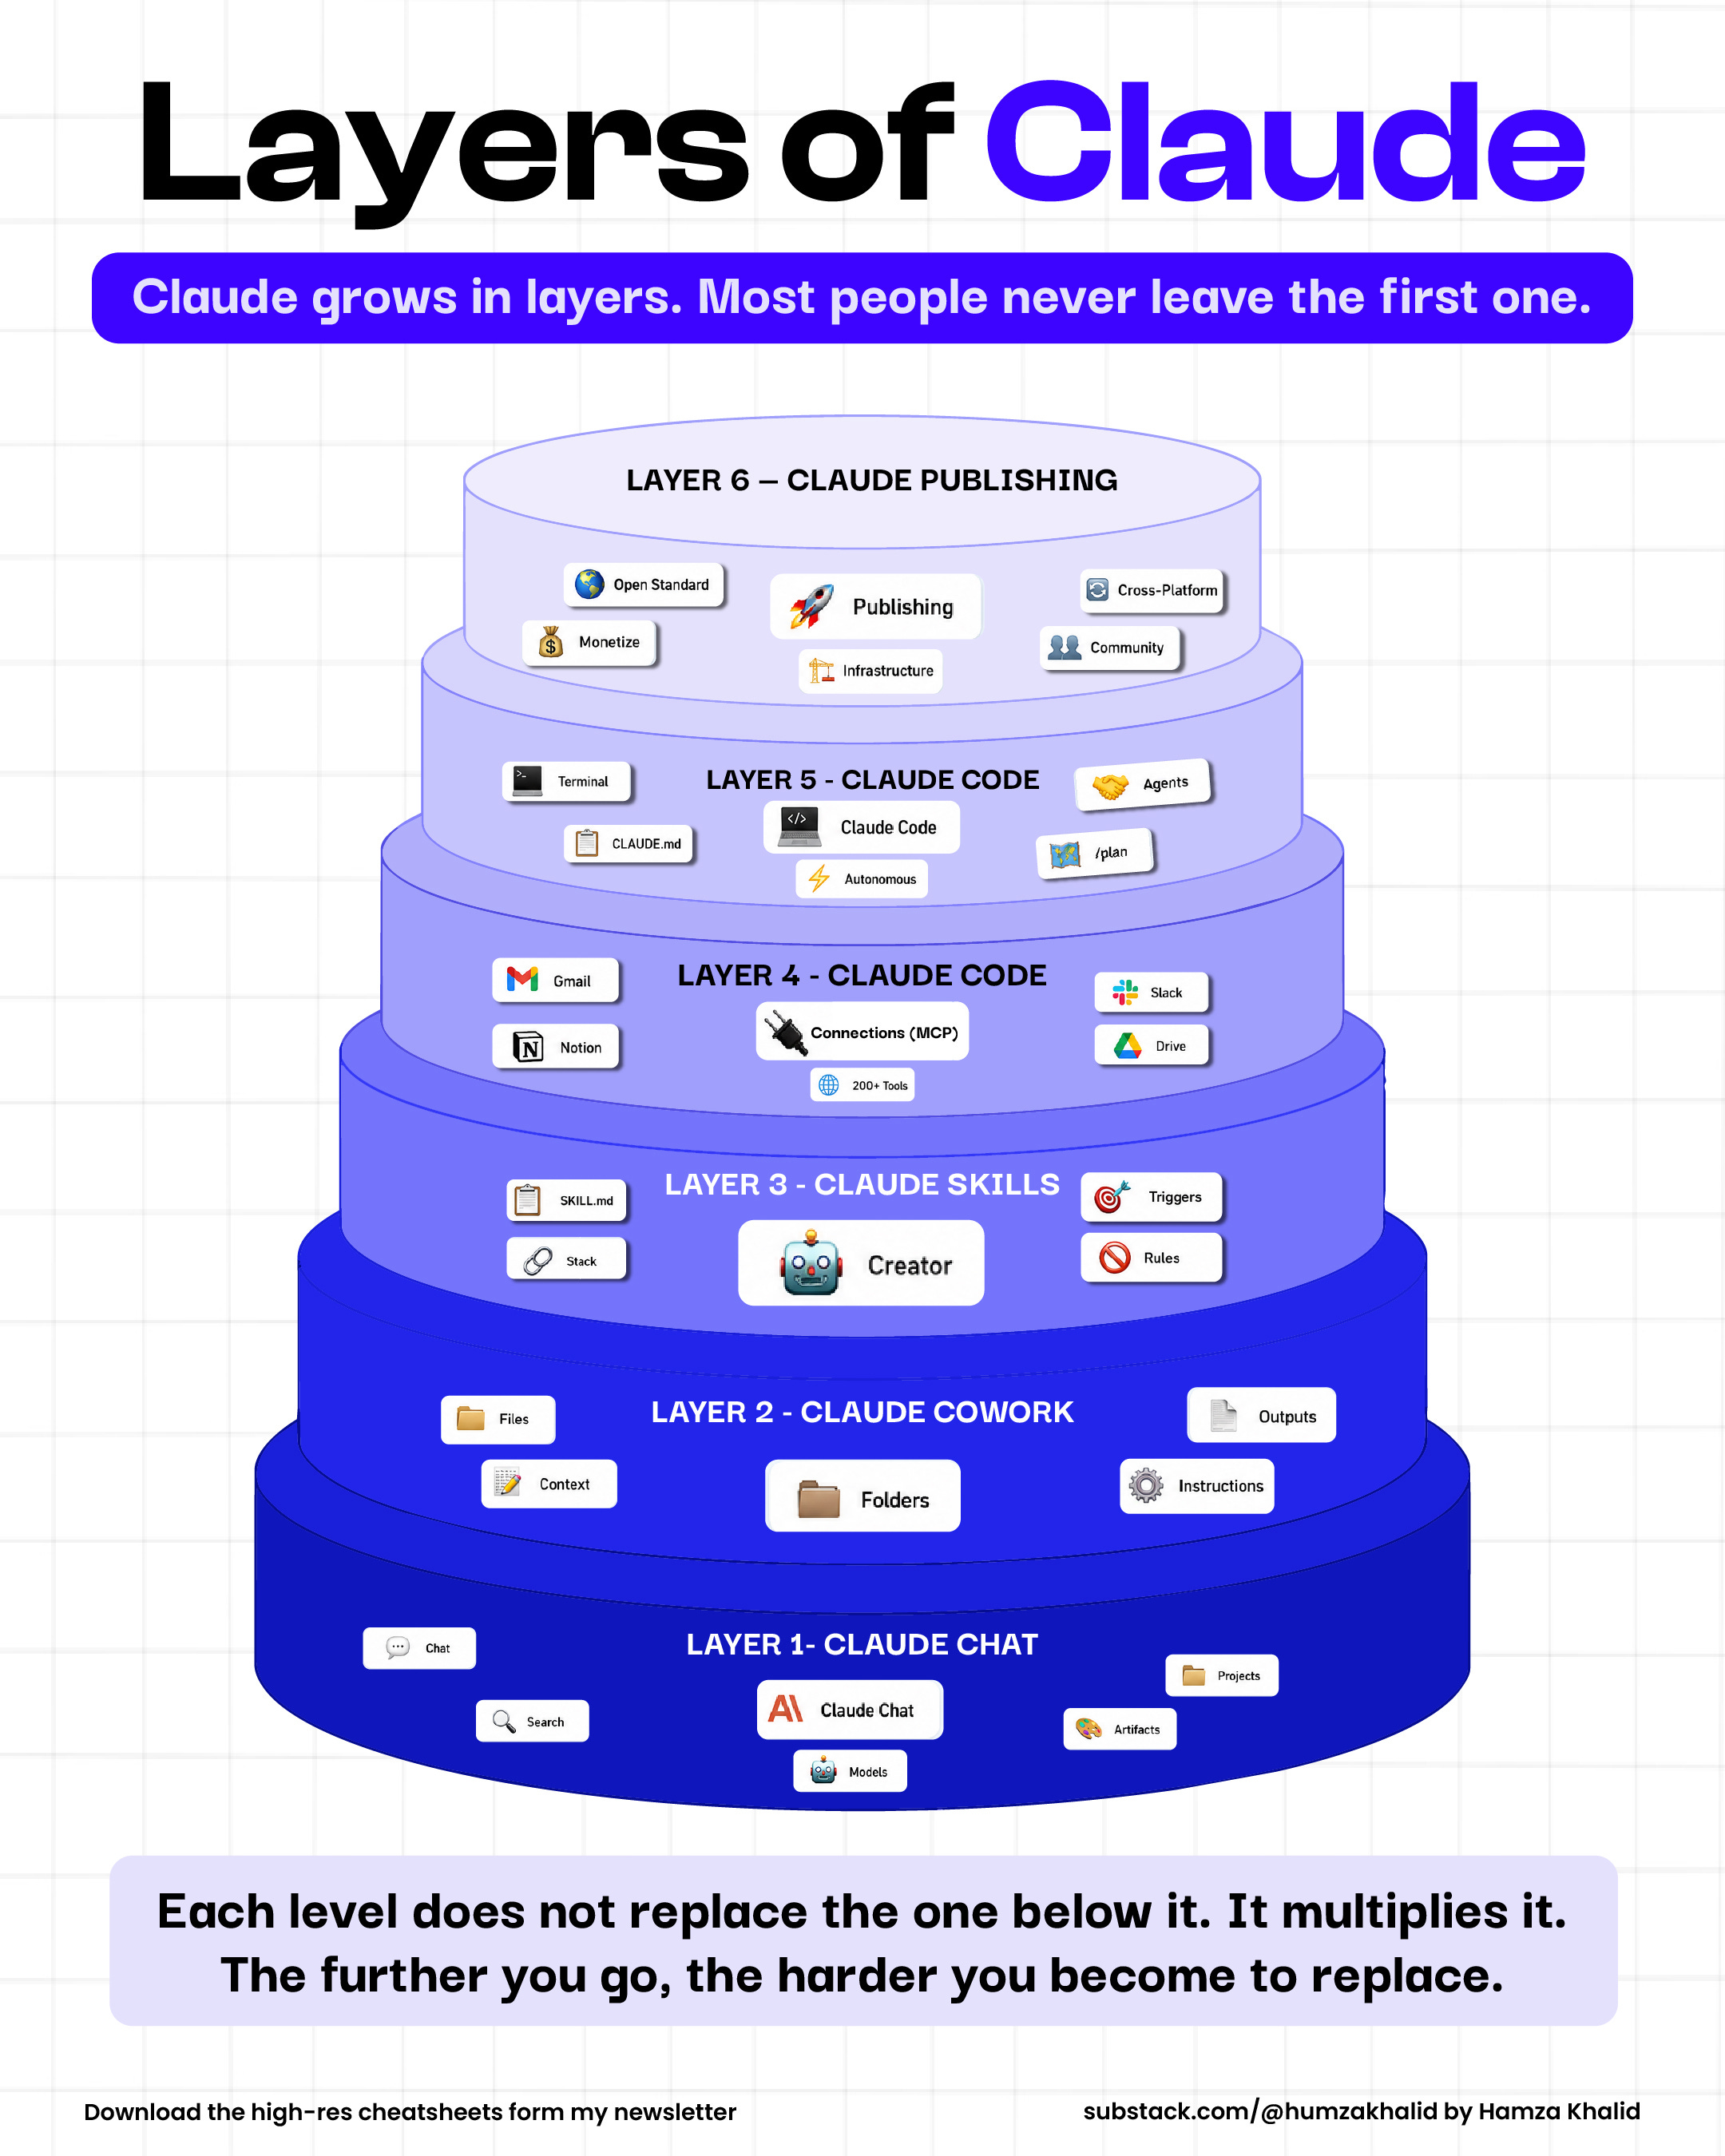
This was not bad, though… but the soul of every infographic was missing.
And now the soul is the motion graphics.
I paste one prompt. I walk away. Ten minutes later, there is a 4K PNG, a looping GIF, and an MP4 sitting in a folder on my desktop.
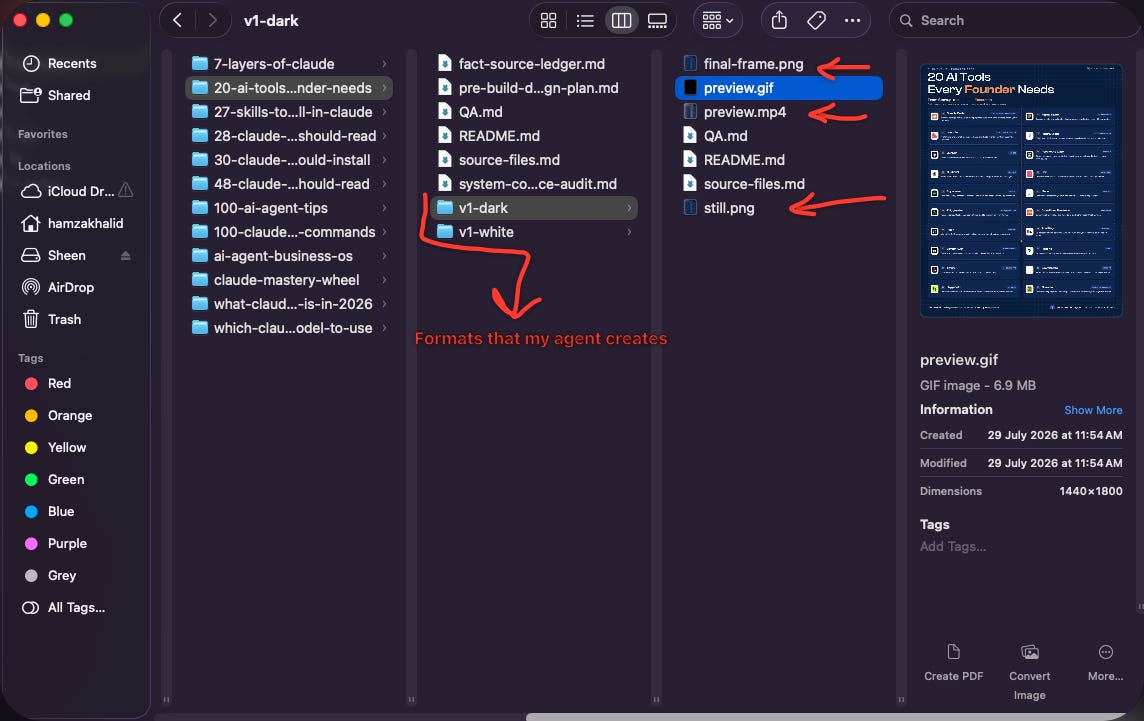
I do not open Canva. I do not open Figma. I do not write a single line of the design.
By the end of this issue, you get the exact mega prompt template I feed the system.
And I am publishing this same breakdown on LinkedIn this week, live, with the screenshots. So you can watch the system produce the very post that explains the system.
Let me show you how it works.
Go check my work first
Before you read another line, do this.
Open my LinkedIn. Scroll my last twenty posts.
Look at the dotted grid. The blue glow. The corner radius on every card. The same footer placement on all of them.

That consistency is not discipline.
I do not have that much discipline.
It is a file called Design.md doing its job while I sleep.
Everything I am about to show you is verifiable. The posts are public.
The part I never talked about
Here is the honest version.
For months, a human designer built my infographics.
He was good. He is still good.
But the loop was slow. I sent a topic. He sent a draft. I sent notes. He sent v2. Two days gone. Sometimes three.
And every new piece started from zero. The lesson from last week never carried into this week.
That was the real problem. Not the speed.
The forgetting.
So I stopped trying to make the designer faster.
I built a system that remembers instead.
The numbers, plainly
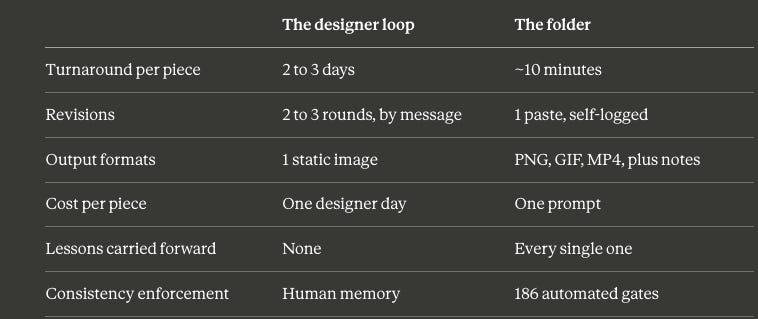
Look at the last two rows. Those are the ones that matter.
Speed is nice. Memory is the moat.
Old way. New way.
The old way: Topic → brief the designer → wait → review → notes → wait → post → forget everything you learned.
The new way: Topic → one paste → wait 10 minutes → approve → the system remembers it forever.
Most people use AI to make one thing faster.
That is the small version.
The bigger version is building a thing that makes every future thing for you, and gets sharper every time you run it.
The infographic is the deliverable.
The folder is the asset.
If this is useful, share it with one person who still designs their own graphics. Takes 10 seconds.
Everything above is the what. Below the line is the how.
The full 15-file folder. Every file explained. The four steps. The 186 gates. The mega prompt that turns one paste into a 4K PNG, a GIF, and an MP4.
Free readers stop here with a nice idea. Paid readers close this tab with a system.
Upgrade to keep reading. First 100 founding members lock in $100 for life - it goes to $300 after.
